

In the Engagement Meter column, Unmetric, a social-media intelligence firm focused on brands, presents trends in social media and recent top-performing brand posts from around APAC. This edition looks at Facebook and specifically Facebook Live.
This edition's insight
Video posts by brands increased 167 percent on Facebook between 2013 and 2016. However, video does not seem to drive as much engagement as you might hope.
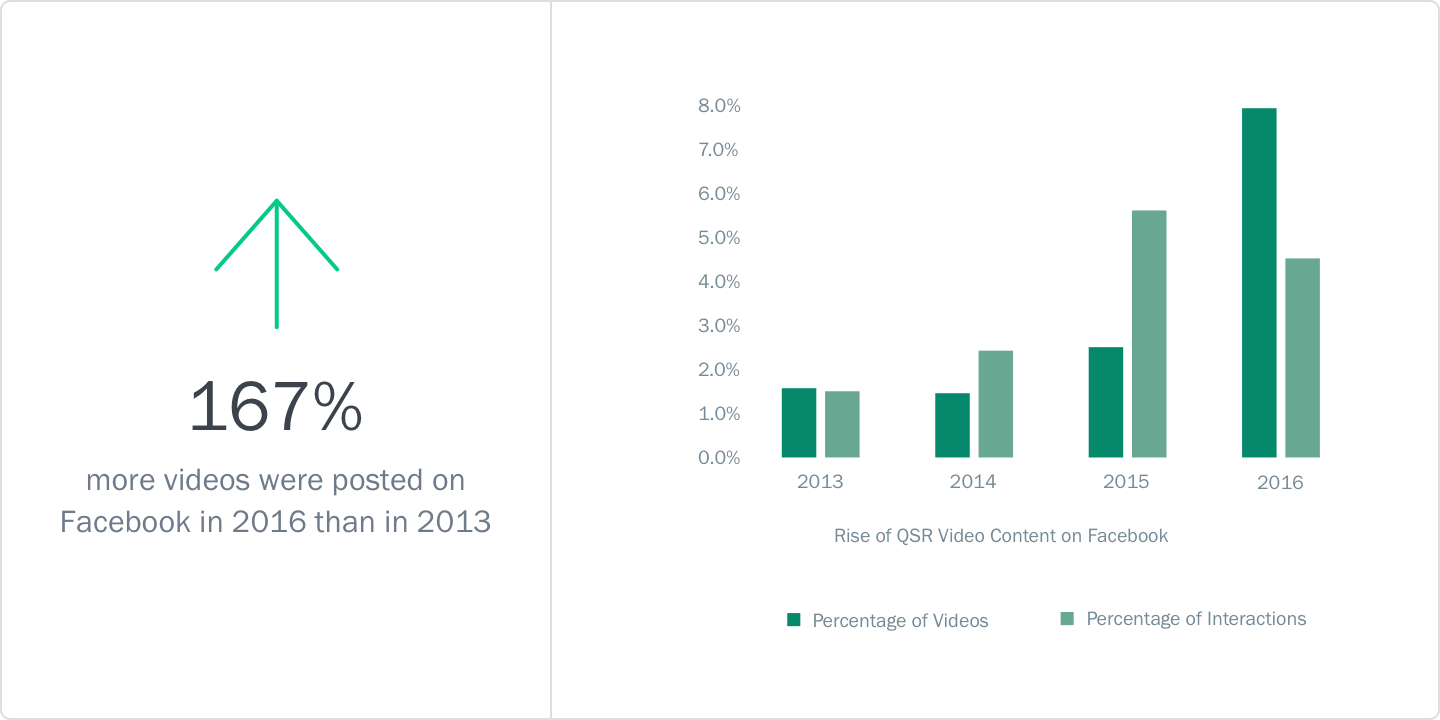
In a recent study on the Indian QSR industy, we found that brands are publishing more videos than ever. Brands published 320 videos in 2016 versus only 120 in 2013. Videos however, only made up 7.6 percent of all content that brands published, with photos remaining by far the most popular type of content. Perhaps one reason for this is that videos are not producing the expected engagement returns for the industry. Our analysis found that although videos made up 7.6 percent of the total content published, they only generated 4.3 percent of the total user interactions. This means that though brands publish more video content than ever before, other content types still bring in the majority of engagement.
Top Facebook posts (July 20 through August 20)
1. Big Babol Indonesia
Engagement* – 1,000
2. Visa Indonesia
Engagement – 1,000
3. HeroMotocorp India
Engagement – 1,000
4. Vodafone Zoozoos India
Engagement – 1,000
5. PUMA Korea
Engagement – 1,000
Top Facebook Live videos (July 20 through August 20)
1. ASUS Philippines
Engagement – 1,000
2. Lay's Thailand
Engagement – 1,000
3. Comfort Vietnam
Engagement – 1,000
4. Jeep India
Engagement – 1,000
5. Godrej Professional India
Engagement – 1,000
* Unmetric's Engagement score rates each piece of content from 0 to 1000 depending on the amount of user interactions, which allows easy comparison of content regardless of the number of fans or followers a brand has.

Ranjani Raghupathi is marketing executive at Unmetric. You can follow her on Twitter @ranjanithinks.
|
.jpg&h=334&w=500&q=100&v=20250320&c=1)


.png&h=334&w=500&q=100&v=20250320&c=1)

.png&h=334&w=500&q=100&v=20250320&c=1)

.png&h=334&w=500&q=100&v=20250320&c=1)


.jpg&h=268&w=401&q=100&v=20250320&c=1)
.png&h=268&w=401&q=100&v=20250320&c=1)

